
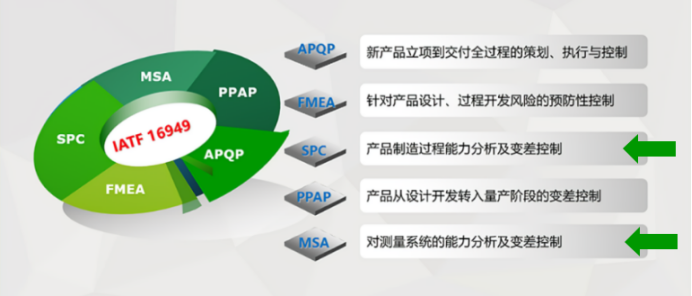
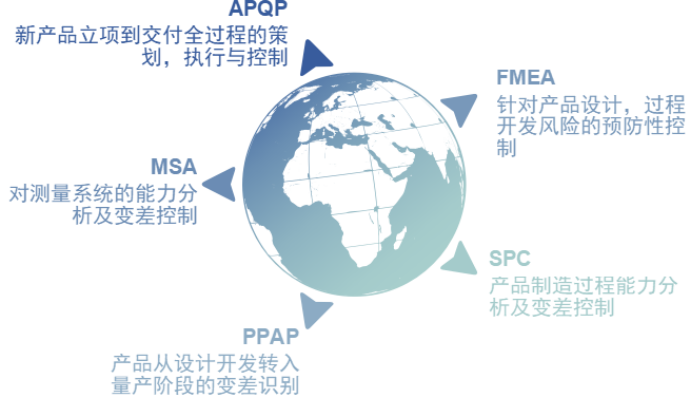
Previously, we conducted learning on the three major modules of APQP, FMEA, and PPAP. This time, we further deepened our study of the remaining two modules—SPC and MSA.
In the continuous pursuit of excellent quality, WDF successfully conducted the second round of IATF 16949:2016 Quality Management System Training at the end of June 2024. This training session also marked the final course of this quality training program. Previously, we conducted learning on the three major modules of APQP, FMEA, and PPAP. This time, we further deepened our study of the remaining two modules — SPC and MSA.
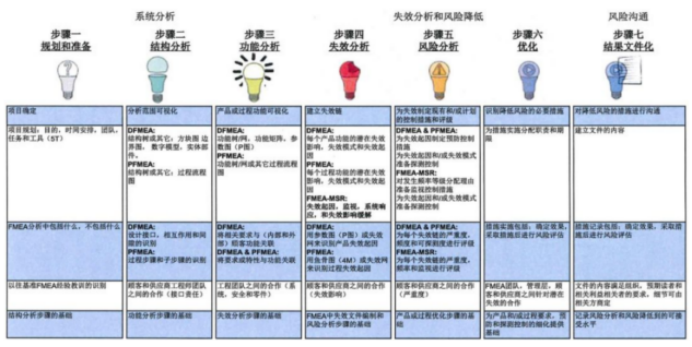
At the beginning of the training, we further studied the seven-step approach of the new FMEA version in depth. Compared with the previous version, the new version adds new processes and provides a structured approach for technical risk records in a precise, interconnected, and complete manner:
① Planning and Preparation: Header Information;
② Structure Analysis: Structure Tree, Design Matrix, Block Diagram Structure, Process Flow Diagram;
③ Function Analysis: Function Tree, P Diagram;
④ Failure Analysis: Failure Tree, Severity (S);
⑤ Risk Analysis: AP, O, D;
⑥ Optimization: Special Characteristics;
⑦ Results Documentation.
Professional Explanation: In-depth Analysis of MSA and SPC
During the training, a quality management instructor was invited to provide a detailed explanation of MSA and SPC. From basic concepts to practical applications and specific case analysis, the instructor presented a comprehensive and practical learning session. Through theoretical learning and case studies, employees gained an in-depth understanding of the importance and application value of MSA and SPC in quality control.
MSA
MSA is the abbreviation for Measurement System Analysis. It is an important tool used in quality management to evaluate and improve measurement system performance. The purpose of MSA is to ensure the accuracy and consistency of measurement systems, thereby improving data reliability and product quality.Sufficient Resolution Is the Prerequisite for Conducting MSA
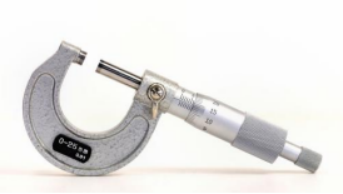
● Resolution is also known as the sensitivity of the measuring device (minimum scale);
● It is an inherent characteristic determined by design;
● It must meet the 1/10 principle.
There are many terms in MSA. The following five characteristics are mainly analyzed, collectively known as the five properties of MSA:
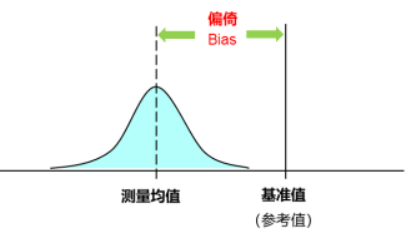
● Bias: The difference between the actual measured value and the true value, usually referred to as “accuracy”; (Bias refers to the same characteristic of the same part.)
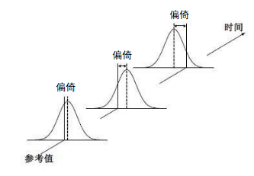
● Stability: The change in bias over time; (Also known as drift, it refers to the total variation obtained when the same measurement system measures the same reference or the same characteristic of the same part.)
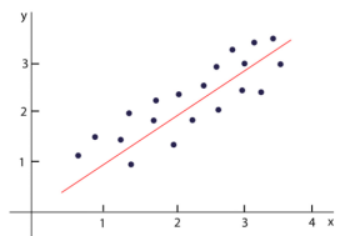
● Linearity: The change in bias within the normal operating range of the measuring instrument, which is composed of systematic errors of the measurement system.
● 重复性:当测量系统已被确定和定义——在确定的零件、仪器、标准、方法、操作者、环境和假设之下,系统内部的变差。
● 再现性:不同的测评人,采用相同的仪器,测量同一零件,同一特性时测量平均值的变差,是系统间的变差。
● Repeatability: When the measurement system has been determined and defined — under specified parts, instruments, standards, methods, operators, environment, and assumptions — the variation within the system.
● Reproducibility: The variation in measurement averages when different appraisers use the same instrument to measure the same part and the same characteristic; it represents variation between systems.
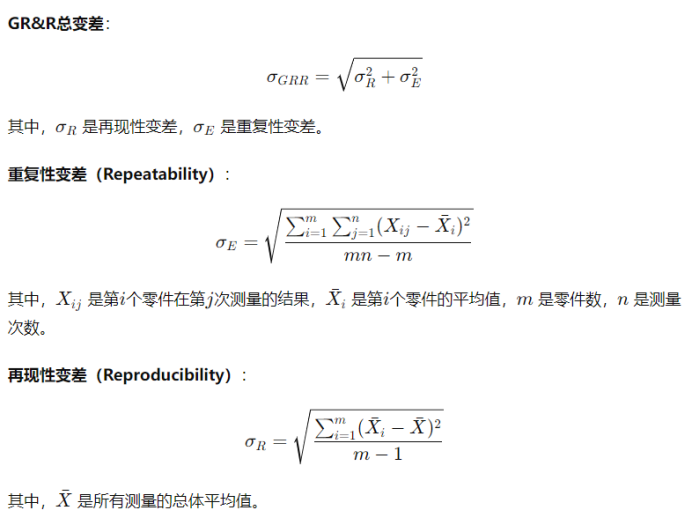
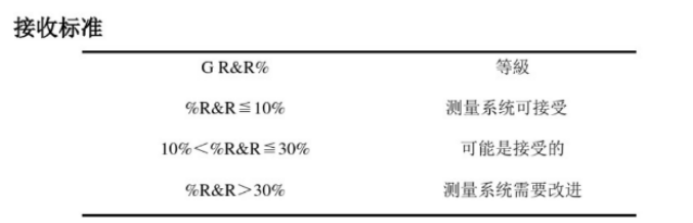
* Among them, repeatability and reproducibility are collectively referred to as R&R or GR&R.
GR&R Analysis Steps
1. Select Samples:
Select several representative part samples, usually 10 or more.
2. Select Operators:
Select several operators, usually 3 or more.
3. Conduct Measurements:
Each operator measures each part multiple times, usually 2 or more times.
4. Data Analysis:
Use analysis of variance (ANOVA) or other statistical methods to calculate repeatability, reproducibility, and total variation.
Minimum Requirements for Measurement Systems:
● Sufficient resolution and sensitivity (1:10 principle);
● Statistical control (variation should only be caused by common causes, not special causes);
● Measurement variation < Process variation < Specification tolerance.
Next, enterprises need to collect a certain amount of sample data for analysis. Sample selection should represent the characteristics of the entire production process or product.
Role of MSA in Quality Control:
① MSA can help us select suitable measurement systems. Based on product characteristics and requirements, MSA evaluates the performance of different measurement systems and selects appropriate measuring equipment.
② MSA can identify and eliminate problems existing in measurement systems. Through analysis of measurement system stability and repeatability, possible errors and variations during measurement can be identified. Then, corresponding improvement measures can be taken to enhance the stability and accuracy of measurement systems.
③ MSA can continuously monitor and control measurement system performance. During product manufacturing, measurement systems may change over time. Through regular MSA analysis, deviations in measurement systems can be identified and corrected in time to ensure product quality stability.
SPC
SPC stands for “Statistical Process Control,” which means statistical process control. It originated after Dr. Walter A. Shewhart in the United States invented control charts in 1924. Through various tools, SPC distinguishes between common cause variation and special cause variation, so that measures can be taken to address special cause variation.
Commonly used statistical tools include histograms, process capability analysis, control charts, and others.
Statistics:
● Collect, organize, display, analyze, and interpret statistical data;
● Use samples (n) to infer the population/group (N);
● A scientific method and tool that enables decision-making through analysis under uncertain conditions.
Data Types:
● Variable Data: Also known as quantitative data, which can be continuously measured using measurement units.
● Attribute Data: Also known as qualitative data, which is obtained through counting methods.
Descriptive Statistics — Distribution
● Random data is usually described through distribution (central tendency, dispersion range, and probability of nonconformity).
● For variable data, the most common distribution is the normal distribution.
Understanding Common Cause Variation:
● The “variation” generated by a process is normal, and these variations cannot be completely eliminated. At a certain level, all processes generate variation.
● If the variation is within the controlled process range and remains within acceptable limits, improvement actions are not required.
● Common cause variation is the natural variation generated by the system. To reduce system variation, the system itself must be changed, which requires greater investment and improvement efforts.
Understanding Special Cause Variation:
● Special variation is an individual error that occurs due to abnormal conditions or factors outside the system. Generally, once the source (root cause) of special variation is identified, improvements can be made without changing the entire system.
● Special variation within a process will result in serious quality issues and cost waste. The greater the variation, the poorer the quality, the greater the waste, and the lower the value added per unit of resource.
From a content perspective, Statistical Process Control consists of two major parts:
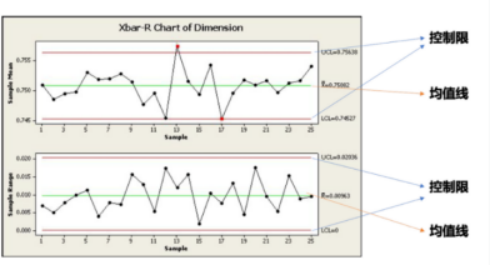
1.Control Charts:Control charts are the main tool of SPC. They are used to monitor process variation and help identify whether special cause variation exists. By using control charts to analyze process stability, abnormal factors existing in the process can be identified and early warnings can be provided.
* Unlike ordinary line charts, SPC charts contain three lines: upper control limit, lower control limit, and mean line. The combination of these lines and data points helps determine whether a process is stable and under control.
2.Process Capability Analysis:Calculate process capability indices to analyze the degree to which stable process capability meets technical requirements and evaluate process quality.
Role of SPC in Quality Control:
SPC emphasizes full-process monitoring, full-system participation, and the use of scientific methods (mainly statistical techniques) to ensure prevention throughout the entire process. SPC is not only applicable to quality control but can also be applied to all management processes (such as product design, market analysis, etc.). It is precisely because of its philosophy of involving all employees in quality management that implementing SPC enables enterprises to truly achieve “prevention and control before problems occur” in quality management.
Practical Interaction: Using Actual Products as Cases
To ensure employees’ understanding and mastery of the knowledge learned, the training specially designed a practical interaction session. Employees were divided into groups, used the company’s actual products as cases for simulation preparation, and conducted explanations and comparisons. This learning method not only enhanced employees’ practical operation capabilities but also improved their teamwork spirit and problem-solving abilities.

(Group discussion and answer recording)
Relaxed Atmosphere: A Learning Experience Combining Education and Fun
Throughout the training, the instructor transformed originally theoretical and tedious knowledge into vivid and engaging content through practical cases and interesting interactive approaches. Through this learning method combining education and entertainment, employees’ interest in learning was stimulated, making the training process both rigorous and enjoyable.
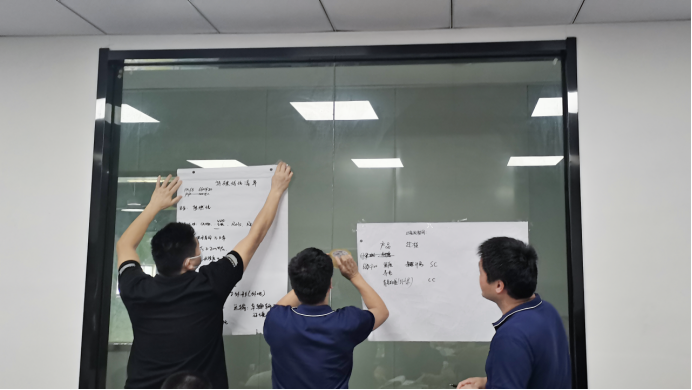
(Displaying answers and providing explanations)
Test Evaluation: Consolidating Knowledge and Improving Skills
After the training, employees participated in a course test. Through the test, employees not only consolidated the knowledge they had learned but also recognized the importance of applying these tools in actual work. This training was not only an improvement of employee capabilities but also a consolidation and enhancement of the company’s quality management system.
Through this MSA and SPC training, WDF employees further improved their ability to apply quality management tools. This not only helps us conduct better quality control in future production processes but also demonstrates the company’s high emphasis on quality and continuous pursuit of excellence.
WDF has always adhered to a customer-centered approach. Through continuous learning, improvement, and innovation, we ensure that we provide customers with satisfactory products and services. With customer satisfaction as our goal, we will continue moving forward firmly on the path of quality management and work together with customers to create a better future.
The completion of this training is only an important milestone on our journey of quality management. In the future, we will continue investing more resources, continuously improving and enhancing our quality management system, and consistently providing customers with quality-assured products. Together with you, we will create a better future.